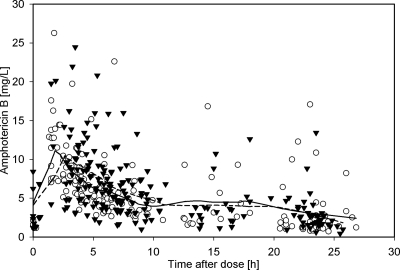
Fig 3.
Observed plasma concentrations of amphotericin B after administration of liposomal amphotericin B as a function of time after dose. Open circles represent the LAMB arm; black triangles represent the CAS-LAMB arm. The solid line is the LOESS curve for the LAMB arm; the dashed line is the LOESS curve for the CAS-LAMB arm.

