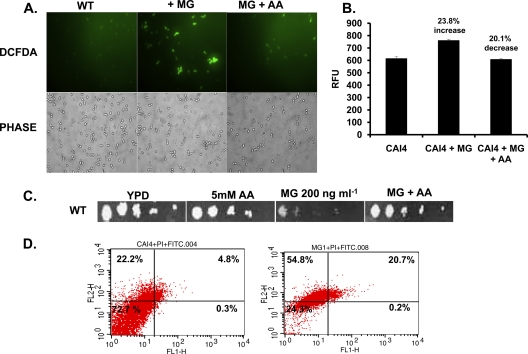
Fig 6.
ROS levels following MG treatment. (A) Measurement of ROS generation using DCFDA in a wild-type C. albicans strain either left untreated or treated with MG (100 ng ml−1) with or without pretreatment with AA. (B) Quantitation of fluorescence in a wild-type C. albicans strain that was either left untreated, treated with MG, or treated first with AA and then with MG. RFU, relative fluorescence units. (C) Serial dilution assay showing that sensitivity to MG (at 200 ng ml−1) is reversed in the presence of AA. (D) Measurement of apoptosis or necrosis in wild-type cells by tracking for FITC or PI labels in the absence (left) or presence (right) of MG (100 ng ml−1).

