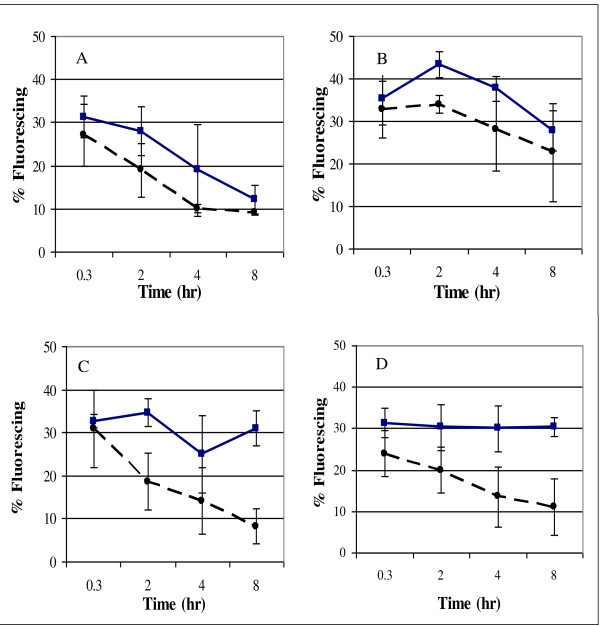
Figure 8.
Levels of reactive oxygen species in XR122N and AJP50 cultures grown in media containing biomass inhibitors. XR122N is represented by solid blue lines and squares, AJP50 by dashed black lines and circles. At each time point, at least 100 cells were surveyed and, the percent of cells fluorescing was recorded. Data from (A) uninhibited control; and cultures grown in media containing (B) 5 mmol/l H2O2, (C) hydroxymethylfurfural (HMF), furfural (FF), and acetic acid, (D) and all 13 inhibitors listed in Table 1. Error bars represent one standard deviation from the mean.

