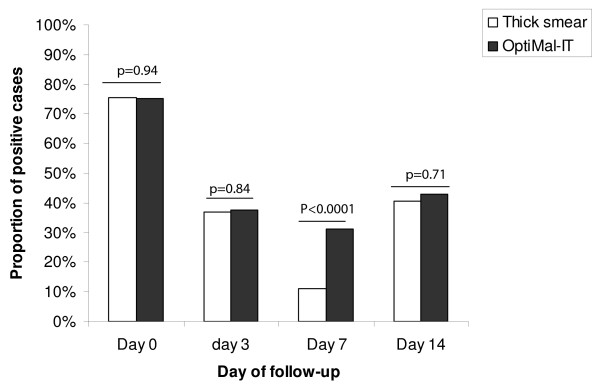
Figure 2.
Dynamics of OptiMal-IT test positivity during patient follow-up after a malaria treatment. The day of follow-up is on the × axis and the proportion of positive cases on the y axis. Results from both tests were comparable during follow-up except for day 7 when the proportion of cases detected by OptiMal-IT was statistically higher compared to the proportion observed with thick smear

