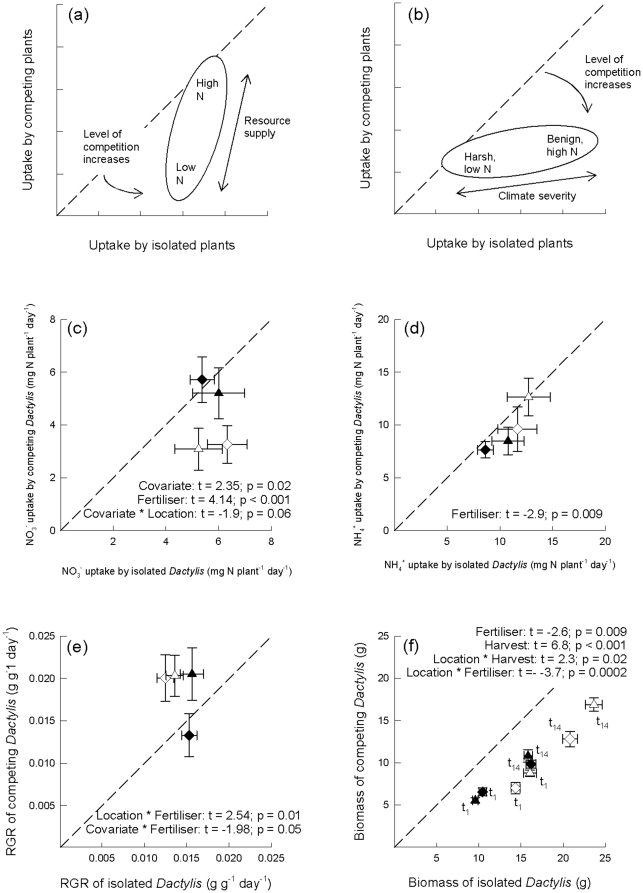
Figure 1. Measures of competition using direct and indirect approaches.
(A) Schematic showing results predicted for hypothesis 1 (plant competition for N will increase under conditions of reduced soil nutrient availability); (B) Schematic showing results predicted for hypothesis 2 (plant competition for N will be weaker in a more climatically severe upland environment, and under lower nutrient availability); (C) Uptake of NO3 −; (D) Uptake of NH4 +; (E) RGR over 14 d; (F) Biomass at final harvest. N uptake, biomass and RGR of Dactylis glomerata when competing against Plantago lanceolata (vertical axes) are plotted against the corresponding measurements for Dactylis when growing in isolation (horizontal axes). Symbols indicate either lowland (triangle) or upland (diamond) locations, under conditions of low (shaded) or high N availability (open). Plot f uses the same notation, but in addition, results for the first and second harvests are separately indicated using t1 and t14, respectively. For plot c, the model explained 40% of the observed variation (4, 31 df); for plot d, 35% (3, 18 df); for plot e, 28% (5,67 df); and for plot f, 62% (6, 150 df). Error bars show 1 standard error of the mean. Dotted lines show the line of equality, i.e. identical uptake, biomass or RGR for competing and isolated Dactylis; the further points fall away from the line of unity, the greater the strength of plant interaction (competition below the line, facilitation above) , i.e. the relative difference between uptake, biomass or RGR of isolated and competing plants is greater. Significant results from ANCOVA tests are shown on each plot.

