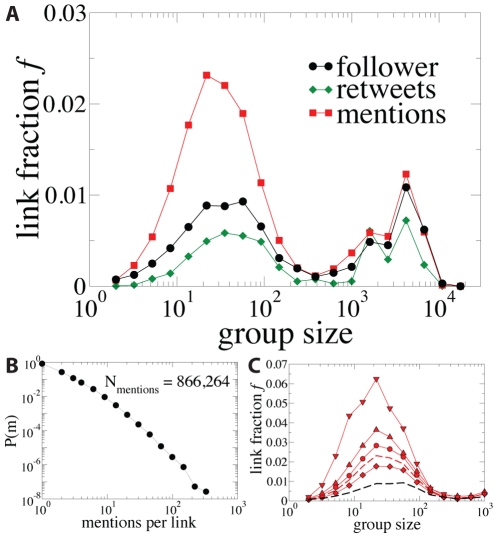
Figure 3. Internal activity.
(A) Fraction  of internal links as a function of the group size in number of users. The curve for the follower network acts as baseline for mentions and retweets. Note that if mentions/retweets were randomly appearing over follower links then the red/green curve should match the black curve. (B) Distribution of the number of mentions per link. (C) Fraction of links with mentions as a function of their intensity. The dashed curves are the total for the follower network (black) and for the links with mentions (red). While the other curves correspond (from bottom to top) to fractions of links with: 1 non-reciprocated mention (diamonds), 3 mentions (circles), 6 mentions (triangle up) and more than 6 reciprocated mentions (triangle down).

