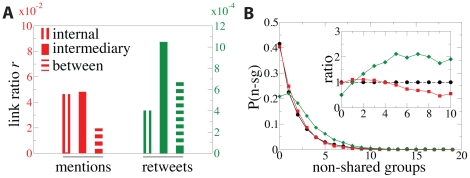
Figure 5. Intermediary links.
(A) Ratio  between the number of links with mentions or retweets and number of follower links. (B) Distribution of the links in the follower network (black curve), those with mentions (red curve) and retweets (green curve) as a function of the number of non-shared groups of the users connected by the link. Inset, ratios between these distributions and the follower network.

