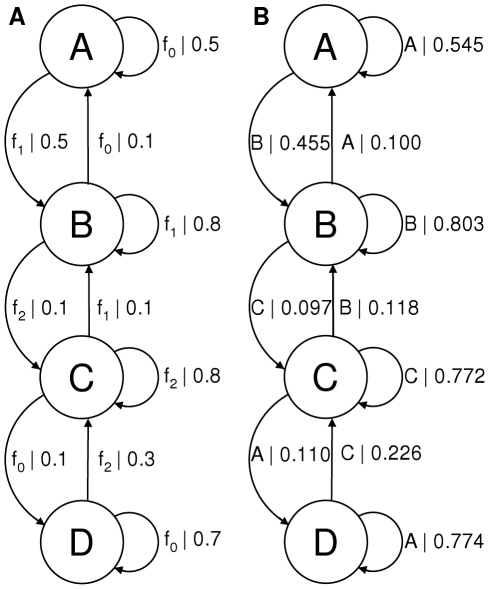
Figure 3. Comparison of generating and inferred HMMs with degenerate states.
A) Model used to generate the data. This 4 state model has two states associated with the FRET level centred at 0.1 (denoted  ) but with different probabilities of remaining in each state. B) The model inferred from the data. It has the correct architecture and the transition probabilities are close to those of the generating model. The model distance between the two is −0.42.

