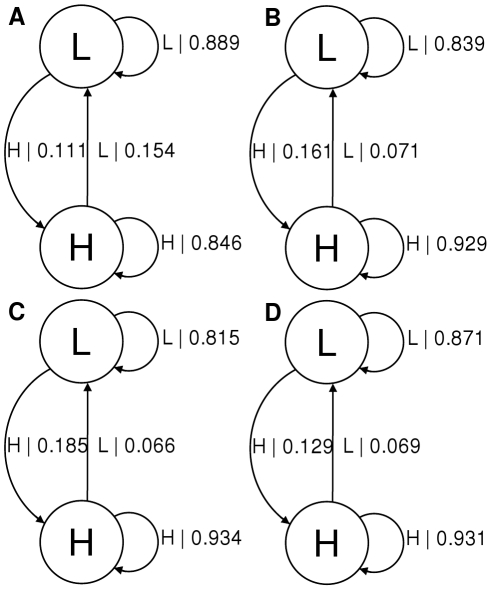
Figure 7. Causal state machines corresponding to the 4 spectra shown in Fig. 6 .
Mg concentrations are A) 30 mM, B) 40 mM, C) 50 mM and D) 60 mM. Note that the actual transition rates are given by dividing transition probabilities by the sampling rate of the data, these were 41 ms per point for 30–50 mM and 71 ms per point for 60 mM.

