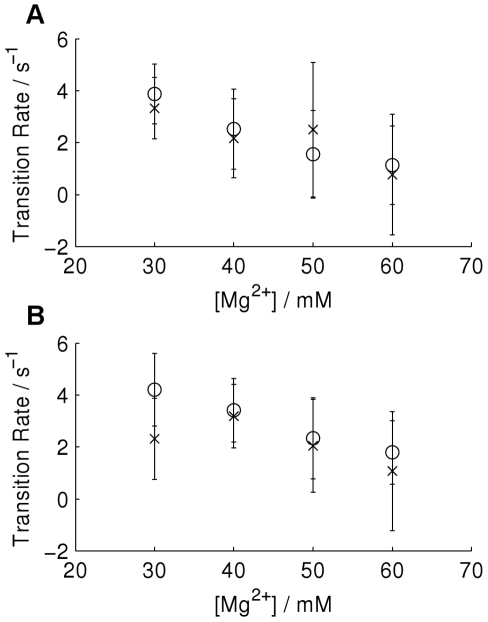
Figure 8. Average transition rates as a function of magnesium ion concentration.
A) shows transition rate from the high FRET state to the low FRET state and B) the low FRET state to the high FRET state, with rates calculated using HaMMy (circles) and the causal state method (crosses). The error bars indicate the standard deviation.

