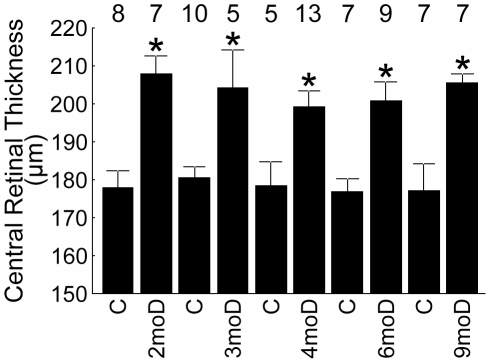
Figure 1. Summary of central retinal thickness.
Data are presented for the diabetic (D, diabetes duration given) and age-matched controls (C) male SD groups. These results strongly support our previous observations of diabetes-induced thickening in this model in vivo [10]. *, significant compared to age-matched control, P<0.05. Error bars represent SEM, and numbers above the bars represent number of animals studied.

