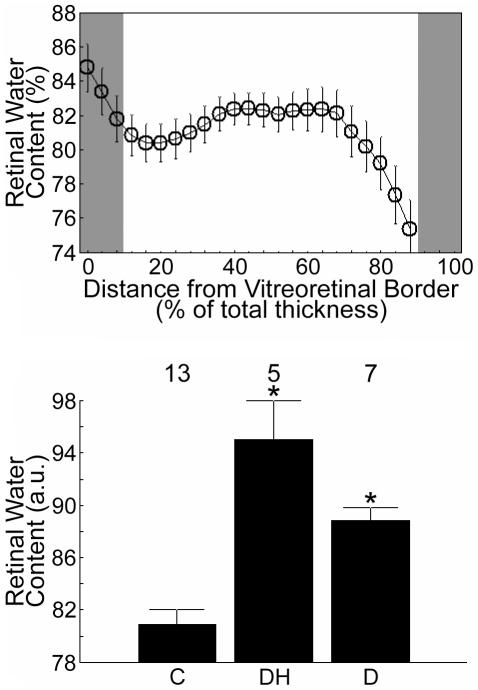
Figure 3. Summary of retinal water content.
Top: Absolute intraretinal water content across the central retina in control rats. The y-axis scaling in this Figure was set to help visualize the variations in intraretinal water content. With this scaling, values <74% are not shown. Due to partial volume averaging and the non-linear effects of the very fast flow in the choroidal circulation (relative to that in the inner retina), water content estimates at depths beyond 88% are considered inaccurate. This region, as well as the tissue near the vitreoretinal border (at 0% thickness), are gray-shaded to indicate that they are excluded from further analysis (see Appendix S1 for more detail). Error bars represent SEM. Bottom: Grand means of relative (see methods) central intraretinal water content (i.e., from 12–88% thickness) for control rats (C & preDH data, here, “C”), dilutional hyponatremia group (postDH data, here, “DH”), and the diabetic group (D). In both graphs, error bars represent SEM. Numbers above the bars represent number of animals studied.

