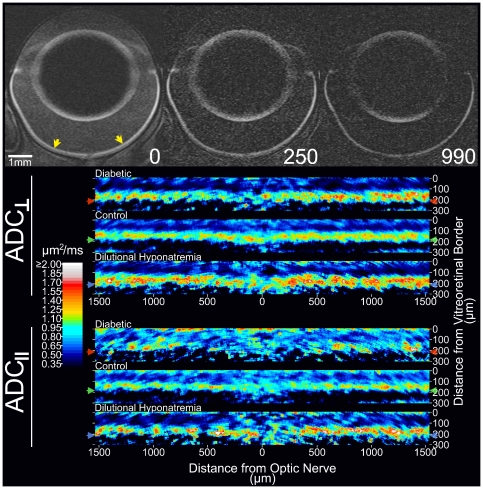
Figure 4. Representative ADC images.
Top (grayscale images): Representative images from a control rat (the same as featured in Figure 2) with diffusion weighting applied parallel to the optic nerve (top/bottom of page in this image orientation). These representative images were collected at three different b-values (from left to right, 0, 250, and 990 s/mm2). Note that, while signal is lost with mild diffusion weighting in vitreous and anterior chamber – signal there being just above background levels at 250 s/mm2 – the retina, with more restricted diffusion, retains signal through b = 990 s/mm2. Preferential signal loss in lateral (relative to the anterior and posterior) lens cortex at higher b-values is due to the preferential movement of water parallel to the lens surface. Yellow arrows in the b = 0 image indicate the region of retina linearized and shown below (measuring from the optic nerve head, ∼±30% of the hemiretinal extent). Bottom (color images): Average ADC maps from each group are presented for visualization purposes only since spatial normalization had not yet been applied (see Legend of Figure 2 for additional discussion). Arrows to the left and right of the color maps indicate the group average location of the retina/choroid border. We also note formal qualitative analysis of ADC (Figure 5) was performed on the linearized and group averaged retinal profile.

