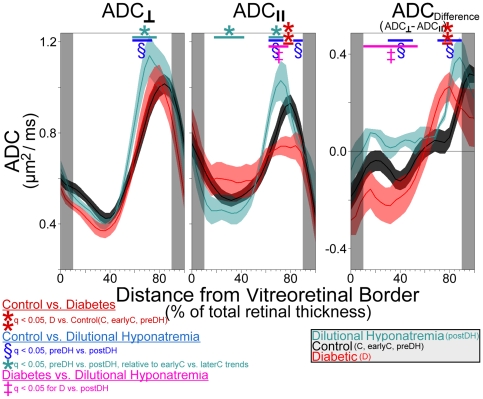
Figure 5. Group comparisons of intraretinal ADC‖‖ and ADC⊥ (i.e., water mobility).
Water mobility profiles for control (black; average of groups C, earlyC, and and preDH; n = 17), dilutional hyponatremia (turquoise; ‘postDH’ group; n = 5), and diabetic (red; group ‘D’; n = 7) retinas. Data points in gray-shaded areas near the vitreoretinal border (0% thickness) and retina/choroid border (100% thickness) are excluded to minimize partial volume averaging with non-retinal tissue (see Appendix S1 for more detail). The solid lines and shaded areas of profiles represent mean and SEM's, respectively. Note that ADC data from the DH group are plotted with the group average control data (groups C, earlyC, and preDH), but statistical findings are based on paired comparisons: Locations where differences between preDH and postDH significantly greater than zero are shown, as are locations where preDH-to-postDH changes were statistically different than the (non-significant) earlyC-to-laterC changes. In either case, we find a significant, heterogeneous, influence of DH on retinal ADC.

