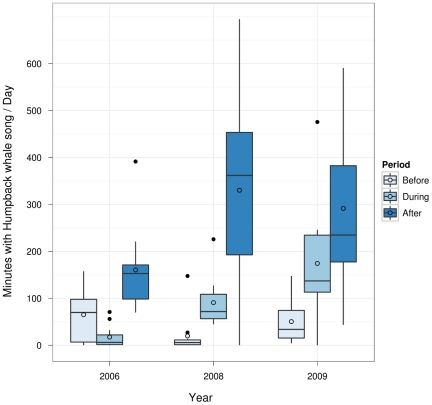
Figure 3. Box-and-Whisker plot of minutes/day containing humpback whale song for 33 days ‘before-during-after’ OAWRS FM pulse transmissions in 2006, and for the same 33 calendar days in 2008 and 2009.
Lower and upper bounds of boxes represent lower and upper quartiles, respectively. Solid lines represent medians and non-filled circles are means. Whiskers represent furthest data points within 1.5× interquartile range (IQR) of the lower and higher quartile, respectively. Filled dots are outliers.

