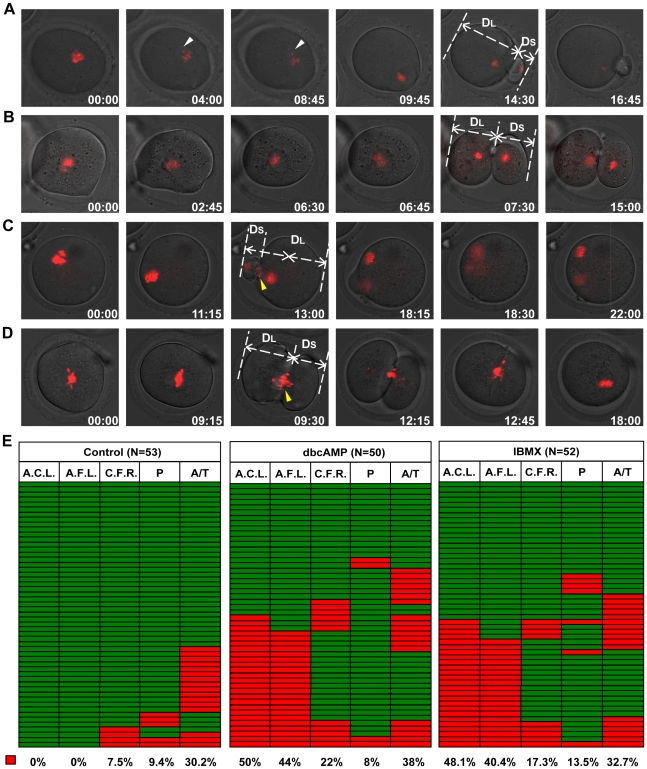
Figure 3. IBMX and dbcAMP treatment perturbed oocyte cytokinesis.
Denuded mouse oocytes at the GV stage were collected and cultured in M16 medium for 90 min. Then, oocytes that had undergone GVBD were transferred into DMSO control medium or medium supplemented with 0.6 mM dbcAMP or 1.0 mM IBMX for subsequent live cell imaging. Representative live cell images were collected from oocytes undergoing normal cytokinesis with furrow abscission (A), symmetric cytokinesis with furrow abscission (B), asymmetric cytokinesis with furrow regression (C) and symmetric cytokinesis with furrow regression (D). White arrowheads: prometaphase lagging chromosome. Yellow arrowheads: anaphase/telophase lagging chromosome. The DL and DS in (A), (B), (C) and (D) represent the vertical distances from the far-end cortex to the cleavage furrow in the larger and smaller daughter cells, respectively. Time points (hours∶minutes) indicate the time elapsed from the beginning of imaging. Chromosomes were stained with Hoechst 33342, shown in red. Corresponding movies are provided in the supplemental materials. (E) Analysis of cell division in the control, dbcAMP and IBMX group, with each row representing a single oocyte division. Colour indicates whether the cell showed the presence (red) or absence (green) of abnormal anaphase chromosome localization (A.C.L., first column) or abnormal cleavage furrow localization (A.F.L., second column); occurrence of cleavage furrow regression (red) or not (green) (C.F.R., third column); presence (red) or absence (green) of lagging chromosomes at prometaphase (P, fourth column) or anaphase/telophase (A/T, fifth column). The proportion of red in each column is included below. Chromosome localization was deemed “abnormal” if the ratio of the shortest chromosome-cortex distance at anaphase initiation (DA) over that at movie initiation (DO) was greater than 0.68 (DA/D0 >0.68). Furrow localization was deemed “abnormal” if DL/DS was less than 1.70 (DL/DS <1.70).

