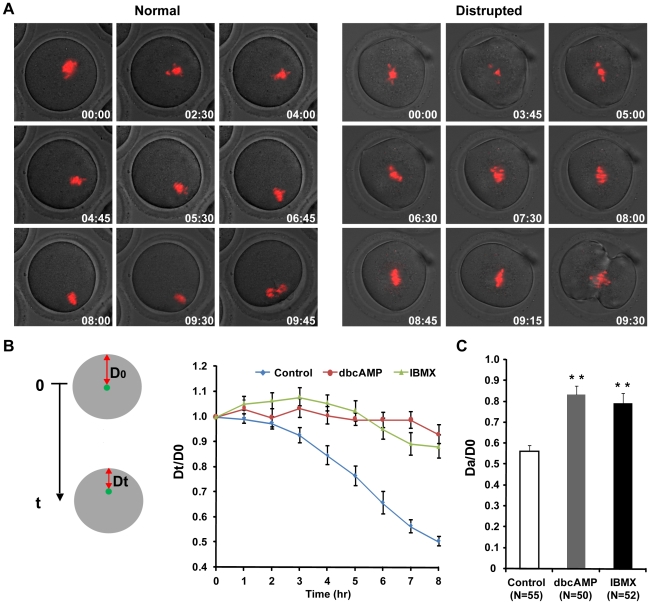
Figure 5. IBMX and dbcAMP treatment of post-GVBD oocytes disturbed chromosome migration.
Denuded GV stage oocytes were first cultured in M16 medium for 90 min; after GVBD, the oocytes were transferred into DMSO control medium or medium supplemented with 0.6 mM dbcAMP or 1.0 mM IBMX for live cell imaging. Chromosome movement was tracked during meiosis I. (A) Representative time-lapse images of chromosome movement from imaging initiation to anaphase onset. Time from imaging initiation is shown (hours∶minutes). Red: DNA. (B) Green dots indicate the position of the chromosome cluster. The shortest distance between the chromosomes and the cortex was measured at each time point (Dt) and divided by the distance to the cortex at the beginning of the experiment (D0). Dt/D0 was used as an indicator of chromosome movement and plotted against time. Panel (C) shows the relative position of the chromosome cluster at anaphase onset, as DA/D0. DA is the shortest distance between the chromosomes and the cortex at anaphase initiation. ** P<0.01, Student's t-test, compared to concurrent control. N: number of cells analyzed.

