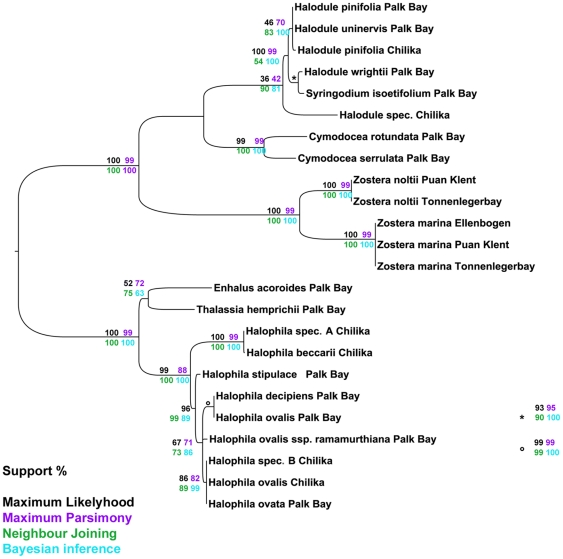
Figure 4. Meta tree of all taxa using matK/rbcL.
Combined tree of matK/rbcL loci, branch support values are given in percent. Support values highlighted by the method used: Maximum Likelihood (black), Maximum Parsimony (violet), Neighbor Joining (green) and Bayesian Analysis (turquoise). Taxa that differed in topology along the different methods are shaded in violet.

