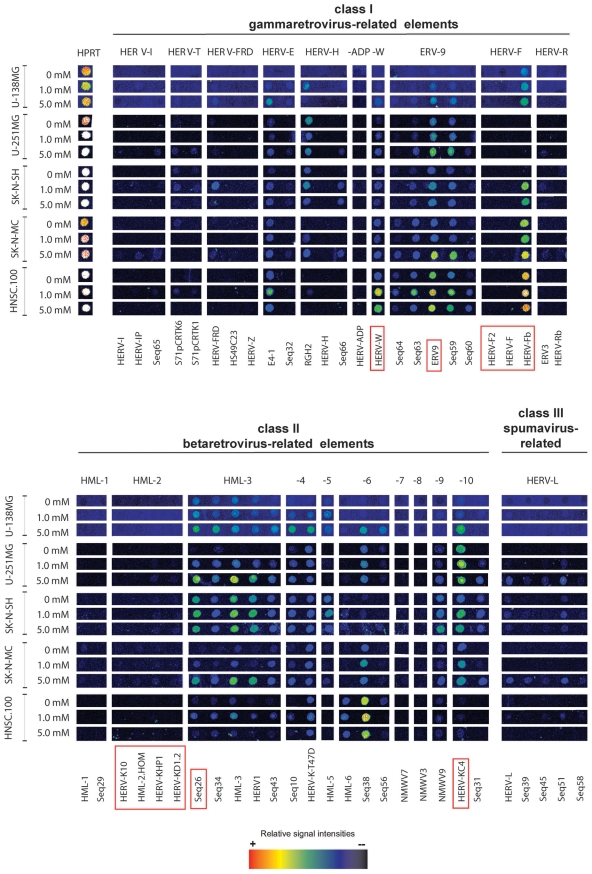
Figure 1. HERV transcription activity in different human brain cell lines after treatment with valproic acid.
15 representative examples of false-color microarray data sets representing untreated and treated (1 or 5 mM VPA) samples from different cell lines were aligned. For detailed information about the identity of microarray capture probes see references [19], [20]. Each positive spot on the microarray represents multiple HERV loci assigned to one subgroup of multicopy HERV elements with sufficient sequence homology that they cannot be distinguished on an individual basis. The housekeeping gene HPRT served as an internal control. Quantitative RT-PCRs were performed for a subset of six differentially active taxa (HERV-W, ERV9, HERV-F, HML-2, Seq26, and HERV-KC4 indicated by red boxes.

