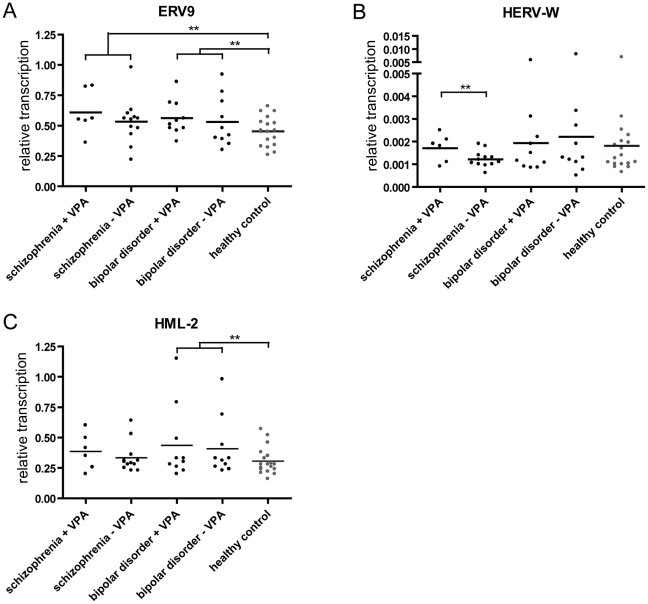
Figure 3. Quantification of HERV transcription in 56 postmortem brain samples by qRT-PCR.
Transcriptional activities of ERV9 (A), HERV-W (B), and HML-2 (C) were analyzed in a subset of 18 schizophrenia-derived brain samples and 20 samples of patients with bipolar disorders with regard to VPA treatment, and compared to 18 healthy individuals. The level of HERV transcripts in each sample was normalized to RPII levels and represents the mean value of at least triplicate experiments. Significant deviation between patient groups according to the Student's t-test is denoted for each HERV taxon by * p≤0.05, ** p≤0.01, *** p≤0.001).

