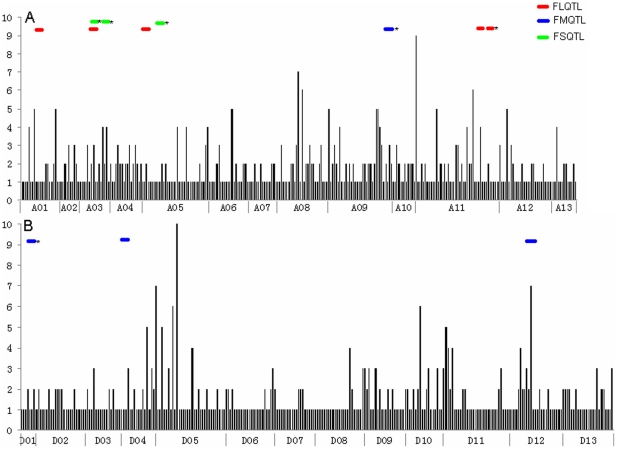
Figure 3. Comparative distributions of eQTL and fiber quality QTL in cotton.
The eQTL density for fiber genes across 13 A- (A) and 13 D-subgenome chromosomes (B). The x axis shows eQTL genetic location on chromosomes, and y axis represents the number of eQTL per cM. QTL for fiber length (FL), strength (FS), and micronaire (FM) are indicated in color bars. *indicates main-effect QTL. Detailed comparisons between locations of eQTL and fiber QTL are plotted in the genetic map in Figure S2.

