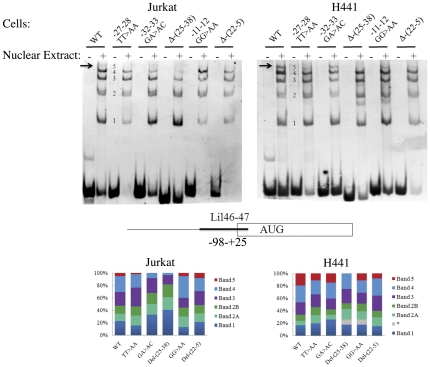
Figure 3. Mutations at various transcription factors binding sites affect protein complexes formation at the vav1 promoter.
Electrophoretic mobility shift assay (EMSA) with Jurkat and H441 nuclear extracts was performed in the presence of lil46-47 digoxigenin-labeled probe (nucleotides −98 to +28 of vav1 promoter). To produce the mutant oligonucleotides, the corresponding mutated plasmids (shown in Fig. 2B schematic) were used as template for the PCR. A schematic of vav1 5′ regulatory sequences, exon 1 and relative oligonucleotide position is shown at the bottom. Bound protein complexes are numbered 1 to 5. The arrow shows the position of complex 5, the heaviest complex that is sensitive to the mutations introduced into the oligonucleotide sequence. The bottom panels of the figure schematically show the relative intensity of bands 1–5 of the EMSA experiment as determined by densitometry (ImageJ software).

