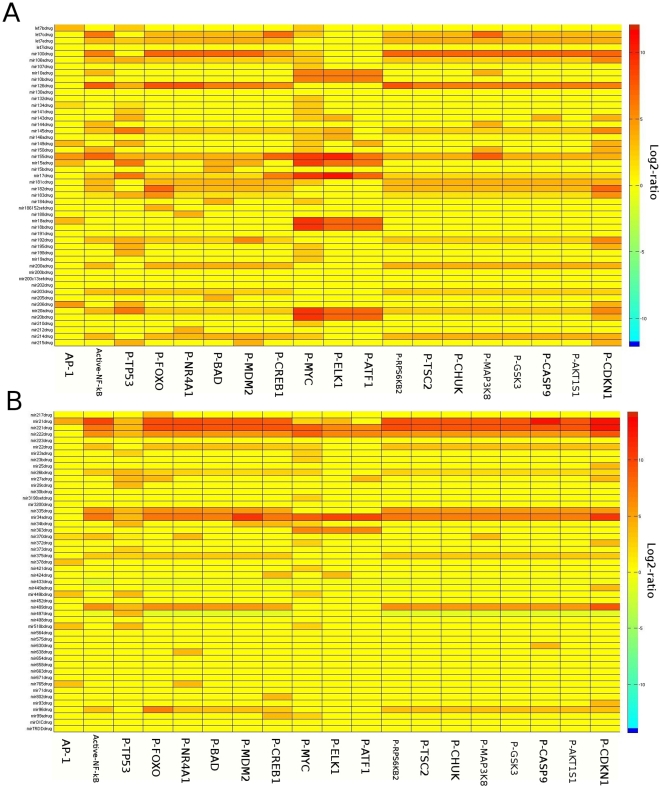
Figure 5. Modeling the individual effect of 100 anti-miRNAs.
A and B: Each anti-miRNA is activated when the corresponding miRNA is over-expressed individually (an anti-mir-combination effect is omitted). Each row in this heatmap represents the predicted anti-miRNA effect and the more columns in the same row appears red or orange, the stronger is the predicted effect that this particular miRNA inhibitor can exert on the EGFR signaling pathway. In this manner, we can examine the impact of each anti-miRNA on this signaling pathway.

