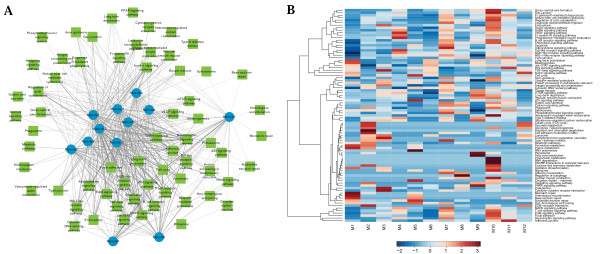
Figure 6.
Module-pathway crosstalk. In both subfigures, only pathways which contain at least one gene on the CHD subnetwork are shown. (A) Network view of module-pathway crosstalk. Blue circles represent modules and green rectangles represent pathways. Edge width corresponds to strength of interaction. (B) Heatmap of module-pathway crosstalk. For clarity, module-pathway activity matrix is x-scaled, which means, for each pathway, colors ranging from blue to red represent the influential power of one particular module compared with all 12 modules.

