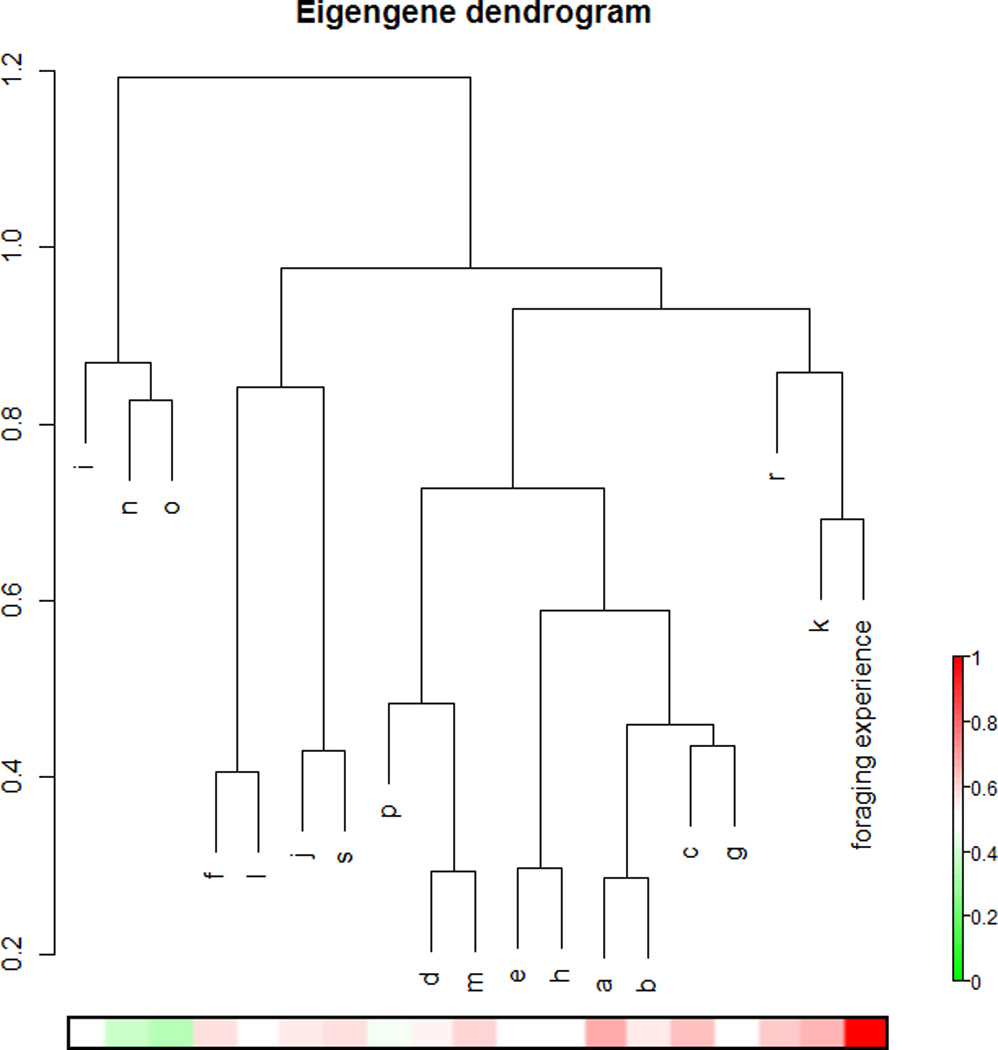
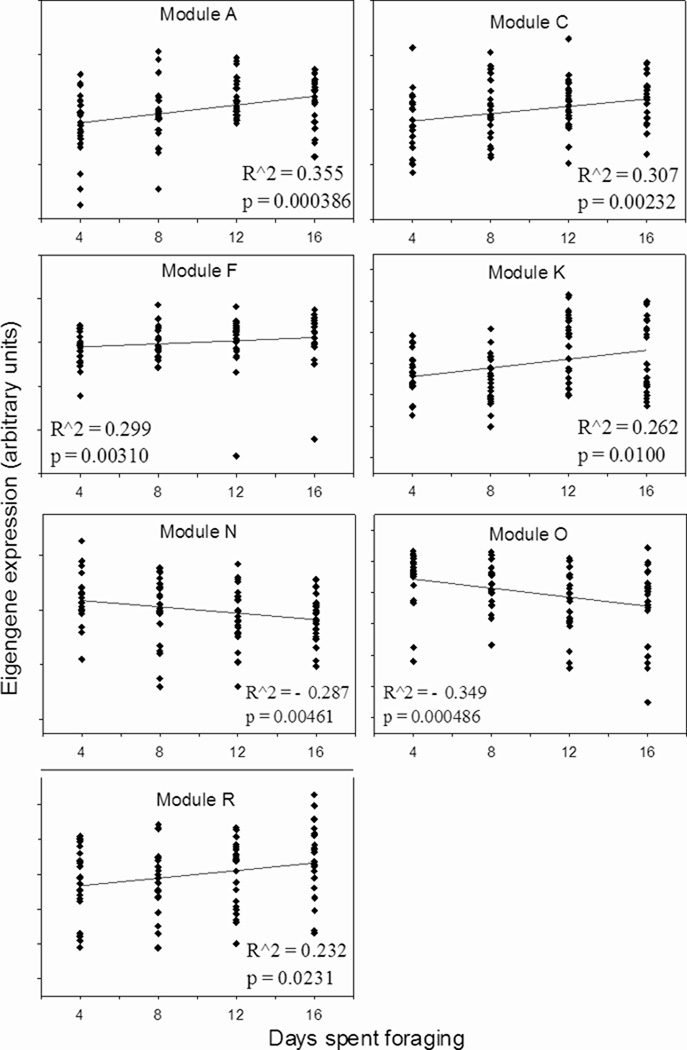
Figure 1.


A. Hierarchical clustering of coexpression modules in the forager network. The number of days each individual had foraged was included in the analysis and is shown here as the arm labeled “foraging experience.” The heatmap below the dendrogram shows the R2 value for the correlation between expression in each module with days of foraging experience, according to the legend on the right.
B. Days spent foraging vs. module eigengene expression for each module showing a significant correlation with foraging experience (Spearman’s rho<0.05). Each point represents an individual forager.
