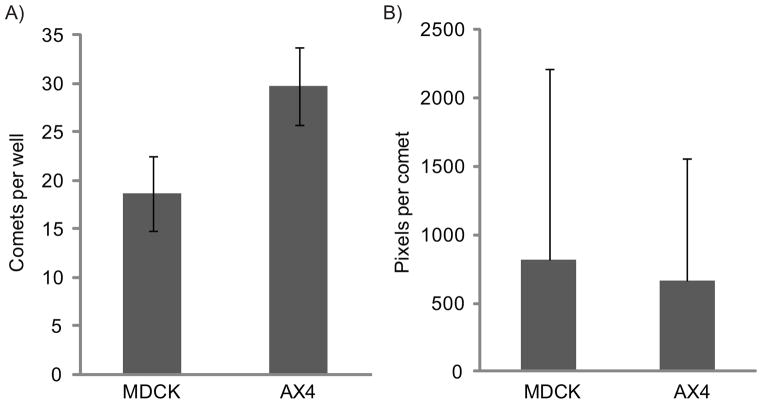
Figure 2.
Comparison of influenza A comets on AX4 and MDCK cell lines. A) Number of visually-identifiable comets per well. The means and standard deviations of 12 wells each are represented. B) Comet size in pixels per comet after thresholding the image. Represented are the means and standard deviations of 224 comets on MDCK cells, and 357 comets on AX4 cells.

