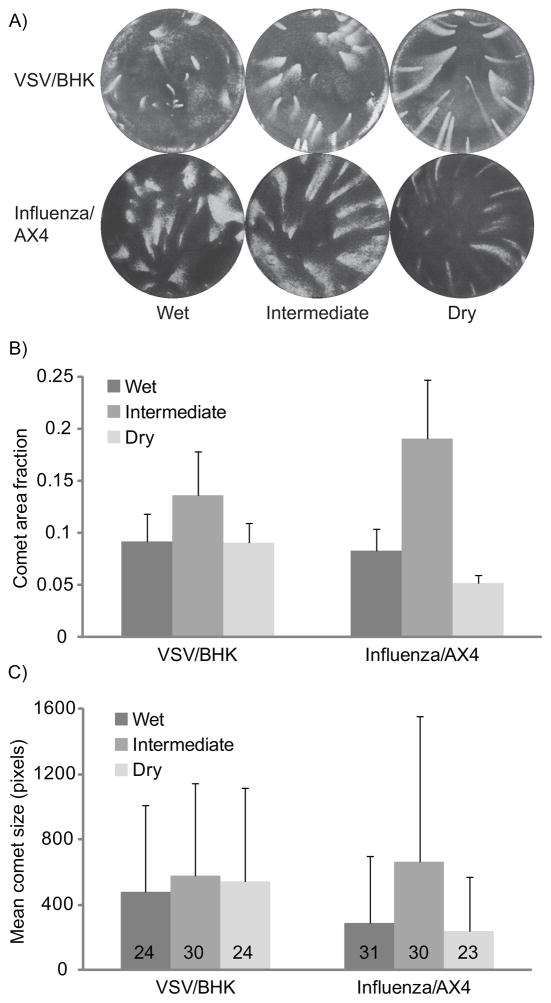
Figure 4.
Comparison of influenza comets on AX4 cells and VSV comets on BHK cells formed under three different environmental humidity conditions. A) Representative images. B) Average unstained fraction of each well, corresponding to total comet area. Means and standard deviation of 6 wells are represented for the dry and wet conditions, and from 12 wells for the intermediate condition. C) Bars represent mean comet size in pixels per comet after thresholding the image. The mean number of comets counted per well is included on the bar corresponding to each condition. Means and standard deviations were calculated from all the individual comets across 6 wells for the dry and wet conditions, and 12 wells for the intermediate condition.

