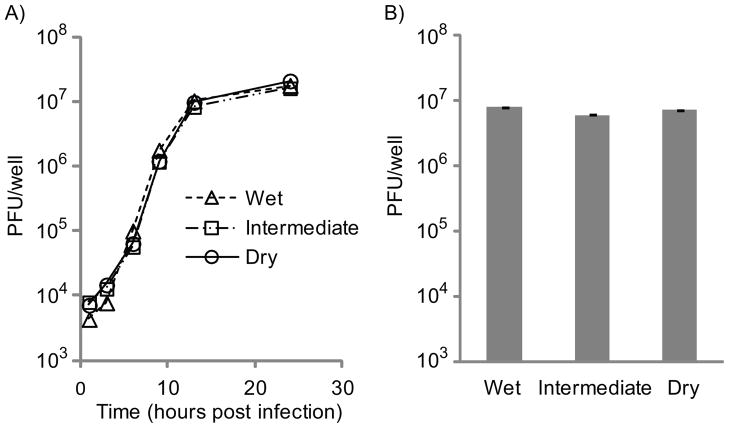
Figure 5.
Influenza A virus burst experiment at three different relative humidity conditions. A) Burst experiment starting with fresh media. AX4 cells were infected at an MOI of 0.8, and parallel wells were sampled at various timepoints and quantified via plaque assay. Infections were incubated at 20% (“dry”), 80% (“intermediate”), or 100% (“wet”) relative humidity. Each data point is the mean of two measurements. Error bars fall within the data points. B) Burst experiment with media and cells pre-conditioned at wet, intermediate, or dry conditions for 19 hours prior to inoculation and incubated at the specified conditions for another 21 hours after inoculation. The virus titers were determined via plaque assay. Each column is the mean of two measurements. Error bars represent the standard deviation.

