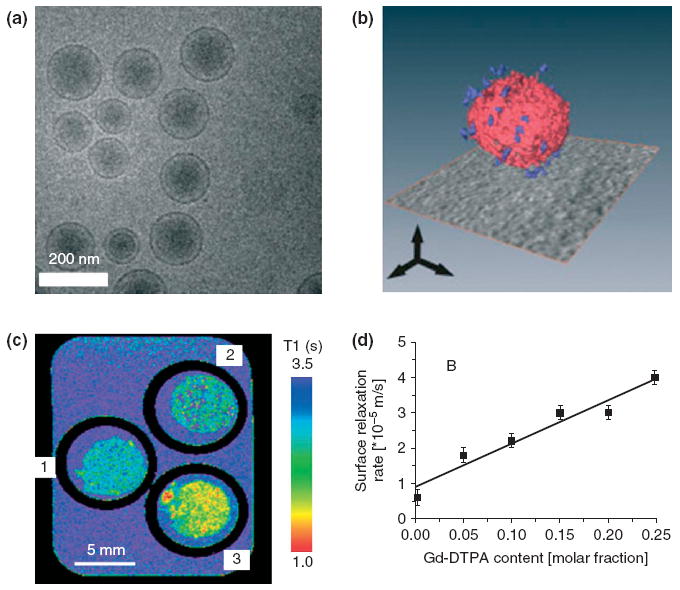
FIGURE 5.

(a) Cryo-TEM image of bare liposomes. (b) 3D reconstruction of CNA35-functionalized liposomes from a series of TEM images. Red: lipid bilayer; Blue: individual CNA35 proteins. (c) T1-map of bovine collagen type I matrices treated with (1) buffer, (2) bare liposomes and (3) CNA35-functionalized liposomes. (d) Surface relaxation rate of bovine collagen type I showed a linear correlation with the molar fraction of Gd-DTPA-BSA in the CNA35-functionalized liposomes. (Reprinted with permission from Ref 72. Copyright 2009 John Wiley and Sons, Ltd).
