
FIGURE 8.
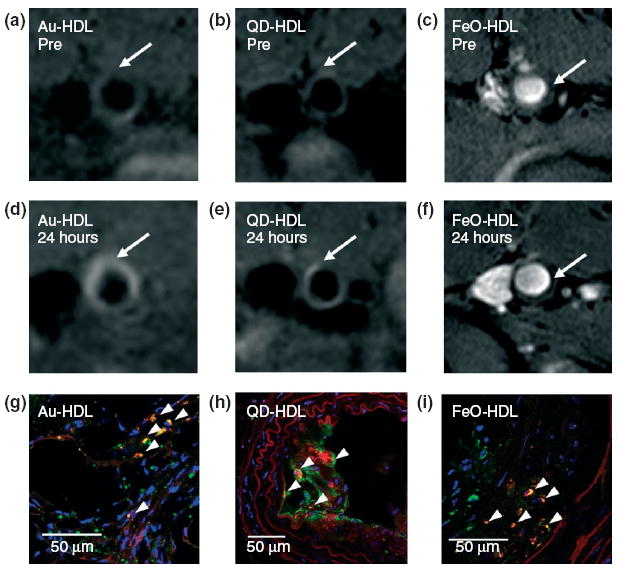
Typical T1-weighted magnetic resonance (MR) images of the apoE−/− mouse aorta (a, b) pre- and (d, e) 24 h postinjection with either Au-HDL or QD-HDL. Arrows point to areas enhanced in the post images. T2*-weighted images of an apoE−/− mouse aorta (c) pre- and (f) 24 h postinjection with FeO-HDL. (g, h, i) Confocal microscopy images of the apoE−/− mouse aortic sections. Red: nanocrystal HDL; Green: macrophages; Blue: nuclei. The arrowheads indicate colocalization of nanocrystal HDL with macrophages. (Reprinted with permission from Ref 54. Copyright 2008 American Chemical Society).