
FIGURE 9.
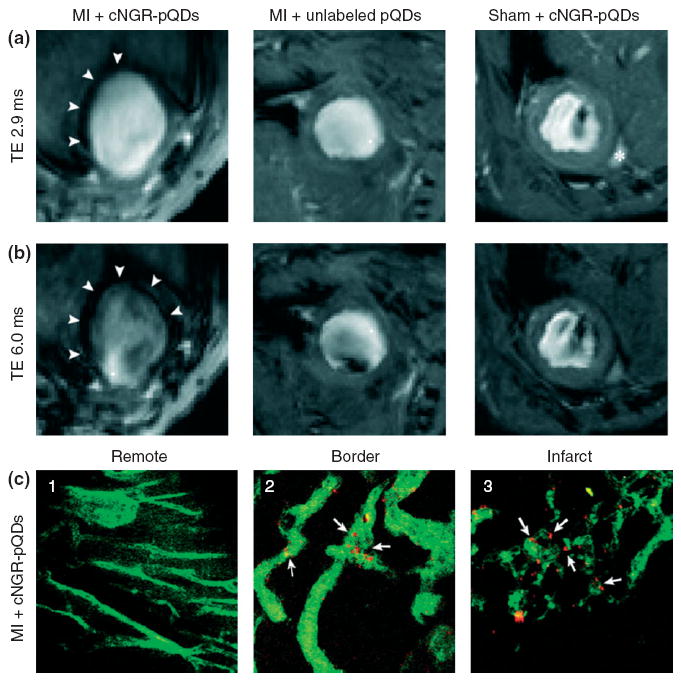
Typical short-axis magnetic resonance (MR) images with an echo time (TE) of (a) 2.9 ms and (b) 6.0 ms for a myocardial infarction (MI) mouse injected with cNGR-pQDs (left), an MI mouse injected with unlabeled QDs (middle), and a sham-operated mouse injected with cNGR-pQDs (right). Arrowheads indicate the hypointense area for MI mouse injected with cNGR-pQDs. (c) Two-photon laser-scanning microscopy revealed that cNGR-pQDs were mainly in the (2) border zone and (3) infarct areas, but not in (1) remote myocardium. Arrows indicate the colocalization of nanoparticles with vasculature. Red: quantum dots; Green: α-CD31-FITC. (Reprinted with permission from Ref 102. Copyright 2010 American Heart Association, Inc.).