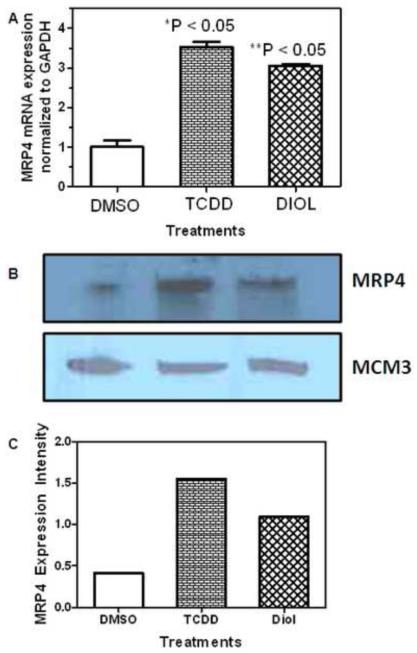
Fig. 2. MRP4 Expression in H358 Cells.
(A) MRP4 mRNA expression. GAPDH was used as a control for the RT-PCR and relative mRNA expression was determined using the ΔΔCt method. The error bars show standard deviations. (*) indicates p <0.05 compared to control and (**) indicates p < 0.05 compared to control; n=3 for each treatment. (B) MRP4 protein expression determined by Western blot for one representative analysis. MCM3 was used as a loading control. (C) Quantitative analysis of image intensity of Western blots in Figure 2B. Analyses were conducted in triplicate using H358 WT cells, H358 cells treated with 10 nM TCDD for 48 h, or H358 cells treated with 2 μM (−)-B[a]P-7,8-dihydrodiol for 24 h.

