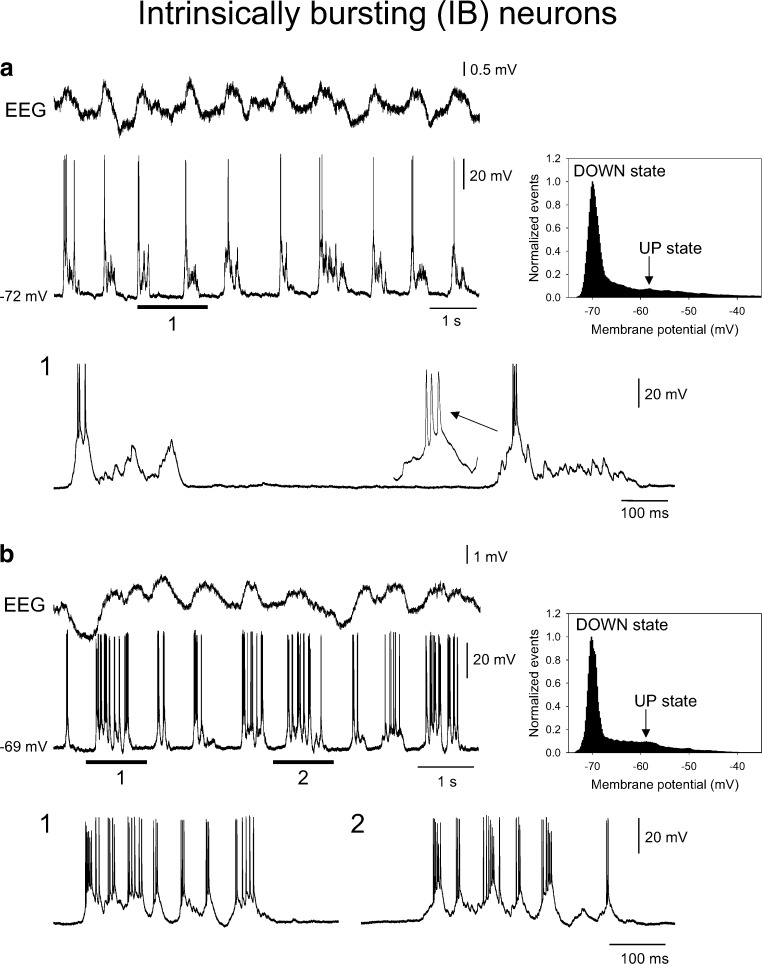
Fig. 7.
Intracellular recordings of layer 5 IB neurons during the slow rhythm. a Combined EEG and intracellular recording of a layer 5 IB neuron during the slow rhythm. The underlined section is enlarged below as indicated. In this neuron, UP states commence with a high-frequency burst that is followed by little or no additional firing (cf. Fig. 2b, top). The plot to the right shows the corresponding membrane potential distribution which exhibits a skewed rather than clear bimodal form. b As in a except that in this case UP states commence with a high-frequency burst that is followed a considerable amount of additional firing (cf. Fig. 2b, bottom). Note: in both a and b, the arrow indicates the UP state values used to calculate the voltage difference between UP and DOWN states in the respective cells

