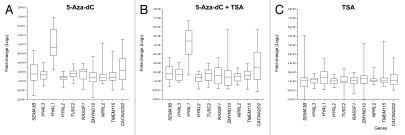
Figure 4.
Effect of epigenetic drugs (5-Aza-dC and trichostatin A, TSA) on gene expression. (A and B) All genes were upregulated by treatment with 5-Aza-dC, isolated and combined with TSA. HYAL1 and CACNA2D2 genes showed the highest expression levels induced by these drugs. (C) Effects on gene transcript levels after isolated treatment with TSA. For each gene, the results are expressed as fold change relative to the reference (respective untreated control cell line) calculated using the ΔΔCt-method normalized to glyceraldehyde-3-phosphate dehydrogenase (GAPDH) expression levels and represent the mean of real-time PCR results of independent biological replicas.

