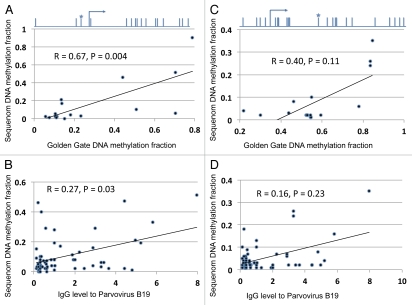
Figure 3.
Validation/replication of DNA methylation marks in two genes using Sequenom analysis. (A and C) Samples assayed for DNA methylation status by GoldenGate and Sequenom (n = 18). Spearman correlation statistics are shown. (B and D) relation between DNA methylation and Parvovirus levels in a unique set of leukemia DNA samples than those used for GoldenGate analysis (n = 45), with Spearman correlation. The location of the CpG site assayed by both the GoldenGate and the Sequenom analysis is graphically illustrated in relation to the transcription start site for gene LTA above (A), and for LCK above the (C).

