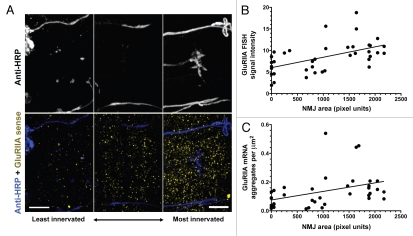
Figure 5.
GluRIIA mRNA aggregate density is proportional to NMJ size. (A) Confocal micrographs showing muscles 6 and 7 in three different homozygous prospero[17] mutant embryos, in which muscle innervation is delayed and variable. The examples are arranged with an example of a very poorly innervated hemisegment on the left, and a relatively normally-innervated hemisegment on the right. Top parts show anti-HRP signal. Bottom parts show anti-HRP signal (blue) and GluRIIA FISH signal (yellow). Scale bar: 10 um. (B) GluRIIA mRNA FISH signal intensity (average pixel intensity) versus NMJ size. (C) GluRIIA mRNA puncta density (aggregates per square micrometer) versus NMJ size. Lines represent best linear fit to all points.

