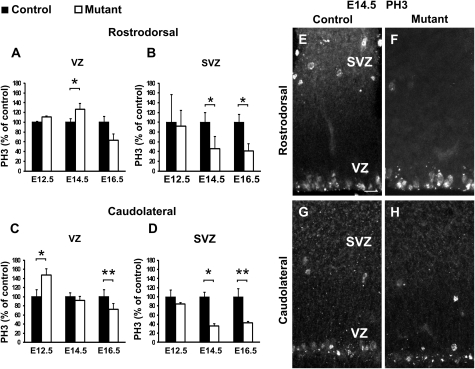
Figure 3.
Temporal and spatial dynamics of proliferation defects follow the expected trajectory of the CP transient neurons in ablated embryos. (A–D) Graphs show percentages of mitotic PH3+ cells in mutant (white bars) relative to control (black bars) embryos in the VZ (A,C) and SVZ (B,D) at rD (A,B) and cL (C,D) levels at E12.5, E14.5, and E16.5. Quantifications of the number of PH3+ cells show a transient increase in VZ proliferation of cL regions at E12.5 (P = 0.02402; n = 3) and of rD regions at E14.5 (P = 0.02487; n = 4) followed by a decrease at all levels by E16.5 (rD: P = 0.15084; cL: P = 0.0017; n = 4). A reduction of SVZ proliferation is detected at E14.5 and E16.5 at both levels (rD: E14.5, P = 0.01482 and E16.5, P = 0.03273; cL: E14.5, P = 0.03167 and E16.5, P = 0.00100). Graphs represent means ± SEM. *P < 0.05 and **P < 0.005. (E–H) Immunostaining for PH3 at both rD (E,F) and cL (G,H) levels at E14.5 shows more numerous mitoses in the VZ with fewer mitoses in the SVZ of mutants (F) at rD levels. At cL levels, both VZ and SVZ display reduced number of mitosis in mutant animals (H) compared with controls (G). Scale bars: E, 20 μm.

