Figure 5.
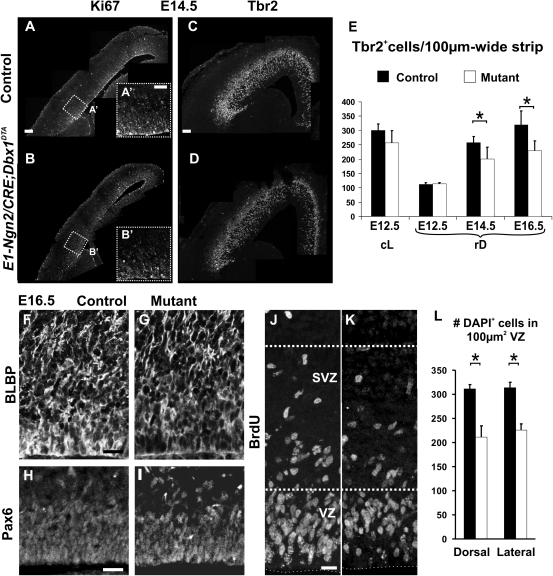
Depletion of RG and IP progenitor pools in E1-Ngn2/CRE;Dbx1DTA animals. (A–B′) Immunohistochemistry for Ki67 shows a global decrease in cycling progenitors in mutant E1-Ngn2/CRE;Dbx1DTA (B,B′) compared with control (A,A′) cortices at E14.5. (C,D) Immunohistochemistry for Tbr2 reveals fewer Tbr2+ cells in the pallium of E14.5 mutant (D) compared with control (C) littermates. (E) Graphs represent the number of Tbr2+ cells through the thickness of the pallium and normalized for 100-μm-wide strips at E12.5 at both cL and rD levels and E14.5 and E16.5 at rD levels in controls (black columns) and mutants (white columns). The number of Tbr2+ cells is reduced, although not statistically significant, at cL levels of E12.5 mutant embryos. At rD levels, a 22% decrease is observed at E14.5 and E16.5 (E14.5: P = 0.023539; E16.5: P = 0.023532). (F–K) Immunohistochemistry for BLBP (F,G) and Pax6 (H,I) on E16.5 control (F,H) and mutant (G,I) animals shows a reduction in the size of the RG pool in the VZ of mutant animals. (J,K) A pulse of BrdU 2 h before sacrifice labeling cells in S-phase reveals fewer cycling progenitors in both VZ and SVZ of E16.5 mutant (K) compared with control (J) littermates. (L) Graph shows the number of DAPI+ nuclei per 100 μm2 boxes of 14-μm-thick coronal sections in the VZ at dorsal and lateral levels in E16.5 mutants (white columns, dorsal: 211.66 ± 22.98, lateral: 225.87 ± 12.87) and controls (black columns, dorsal: 311.62 ± 8.3, lateral: 313.56 ± 11.43) (P = 0.026 in dorsal and P = 0.036 in lateral). Graphs represent means ± SEM. *P < 0.05. Scale bars: A,C, 100 μm; A′,F,H, 50 μm; and J, 20 μm.

