Figure 7.
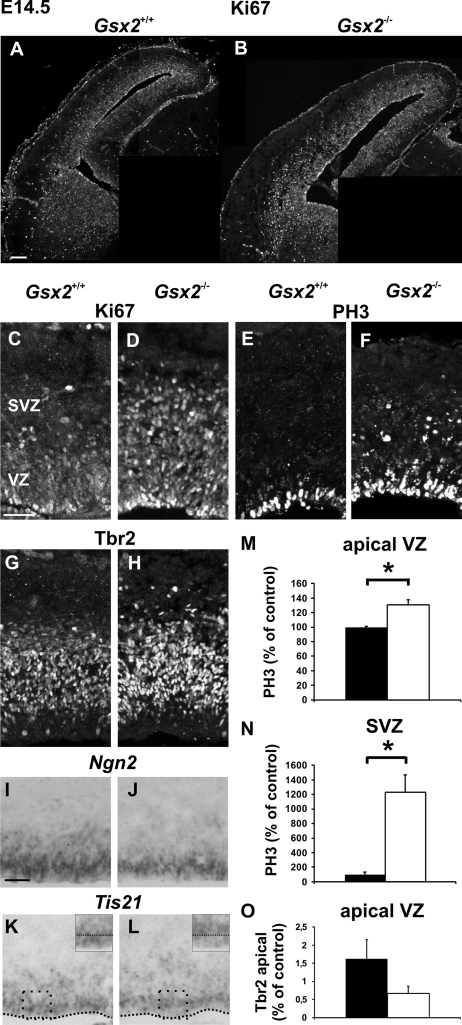
Increased proliferation of pallial progenitors at midneurogenesis in Gsx2 mutants. (A–D) Immunostaining for Ki67 on E14.5 telencephalons reveals an increase in the number of proliferative cells in the pallium of Gsx2 mutants (B,D) compared with Gsx2+/+ controls (A,C) affecting both the VZ and the SVZ. (E–H) Immunostaining for PH3 (E,F) and Tbr2 (G,H) on the same animals showing an increment in the number of cycling cells in mitosis in both VZ and SVZ, as well as an increase in the number of IPs and/or of young neurons in Gsx2−/− mutants brains (F,H). (I–L) In situ hybridization for Ngn2 (I,J) and Tis21 (K,L) confirms a decreased fraction of neurogenic divisions in Gsx2−/− mutants in both VZ and SVZ. High magnifications of boxes in (K,L) show that the decrease in Tis21 staining is more pronounced in the apical VZ. (M,N) Graphs show percentages of mitotic PH3+ cells in mutant (white columns) relative to control (black columns) embryos in the apical VZ (M) and SVZ (N) at rD levels at E14.5. Values for the VZ are 27.39 ± 0.38 (control) and 35.88 ± 1.92 (mutant) (P = 0.0497) and for the SVZ 1.15 ± 0.38 (control) and 14.27 ± 2.70 (mutant) (P = 0.0406). (O) Graphs represent the number of Tbr2+ cells at the apical VZ normalized for 100-μm-wide strips at rD levels at E14.5 in controls (black columns) and mutants (white columns). The number of Tbr2+ cells is reduced, although not statistically significant (1.625 ± 0.53 (control) and 0.666 ± 0.20 (mutant)) (P = 0.094). Graphs represent means ± SEM. *P < 0.05. Scale bars: A, 100 μm; C,I, 50 μm.

