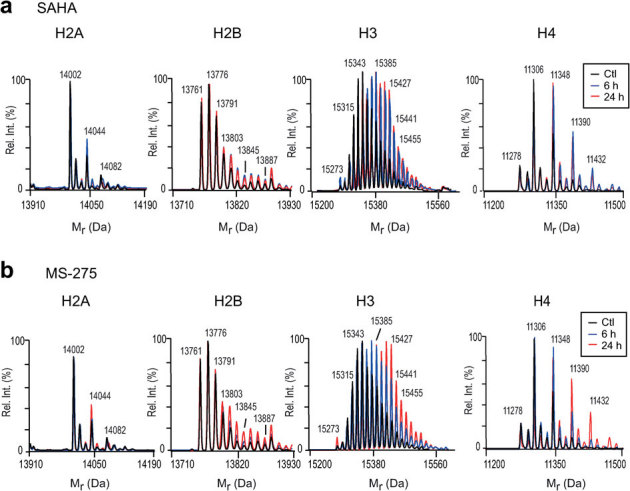
Figure 2. LC-MS analyses of intact histones derived from transformed cells.

Intact histone profiles from K562 cells treated with SAHA (a) or MS-275 (b). Color traces indicate histones purified from control cells (black) or cells treated for 6 h (blue) or 24 h (red) with either 1 μM SAHA or 1 μM MS-275 (both dissolved in DMSO). Ctl: Control cells were treated with DMSO only.
