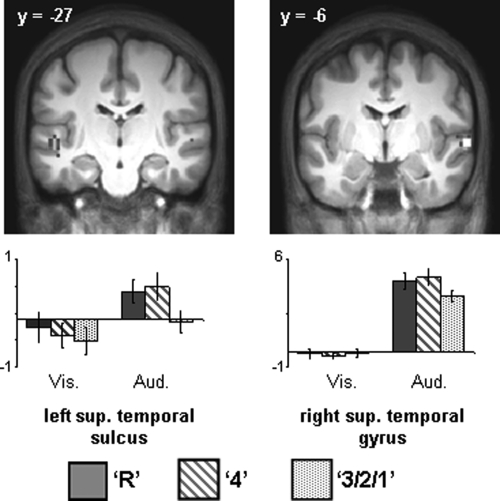
Figure 3.
(Upper) Auditorily selective subsequent familiarity effects (P < 0.01) that overlap regions demonstrating auditorily selective activity (P < 0.001). (Lower) Bar plots of mean parameter estimates (in arbitrary units) for recollected, familiar, and forgotten study items in left superior temporal sulcus and right superior temporal gyrus.

