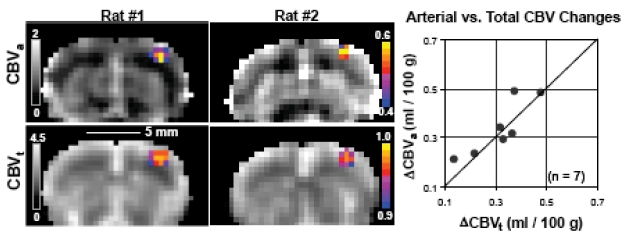
Fig. (5).
Quantitative baseline hemodynamic maps and responses to somatosensory stimulation [37]. Images are shown from two out of seven animals. CBVa maps (grayscale images in top row) were acquired with MT-varied ASL, while CBVt maps (grayscale images in bottom row) were obtained with 15 mg Fe/kg contrast agent, where quantitative baseline values are shown in units of ml/100g. Functional activation maps for ΔCBVa (color overlays in top row) and ΔCBVt (color overlays in bottom row) are shown as cross-correlation values. Activation foci are all located in the forelimb somatosensory cortex. Quantitative comparisons of ΔCBVa vs. ΔCBVt (right plot) were made by taking the differences between baseline and stimulation conditions within a 9-pixel region (i.e., 1.4×1.4×2.0 mm3) centered over the anatomically-defined somatosensory cortex. The similarity of ΔCBVt and ΔCBVa (within measurement error), indicates that arterial CBV changes are dominant. The line of identity is shown.

