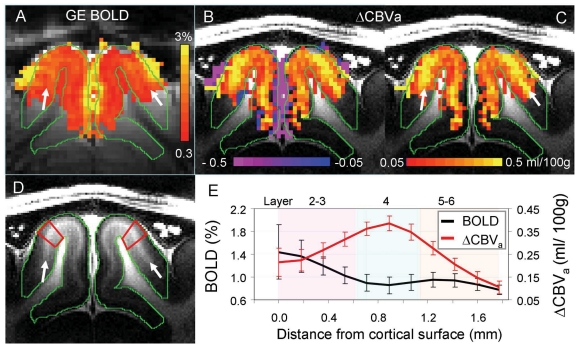
Fig. (6).
Gradient-echo BOLD vs. arterial CBV-based fMRI responses to visual stimulation in isoflurane-anesthetized cats at 9.4 T [30]. Images and functional maps illustrate results from one of seven animals. A: gradient-echo BOLD fMRI with TE = 20 ms (without MT). To determine arterial CBV changes, only pixels which are active in BOLD fMRI were selected. Then, intercepts were calculated from gradientecho BOLD data acquired at 3 different MT levels. B & C: intercept maps. Since negative intercepts (purple) are likely due to a reduction of the MT-insensitive CSF volume, only positive intercepts (red/yellow) were converted to ΔCBVa values for quantification, shown in C. Clearly, the highest CBVa change is located at the middle of the cortex indicated by white arrows. D: T1-weighted anatomic image showing gray and white matter contrast. The visual cortex indicated by green contours has a myelin-rich hyperintense band at the middle of the cortex (white arrows), indicating layer 4. E: average cortical depth profiles of GE BOLD fMRI (without MT) and ΔCBVa obtained from quadrangular ROIs in area 18 (illustrated by red outlines in D). Approximate cortical layer locations were determined by the relative distances of those layers in area 18 [48]. Error bars: SEM (n = 7).

