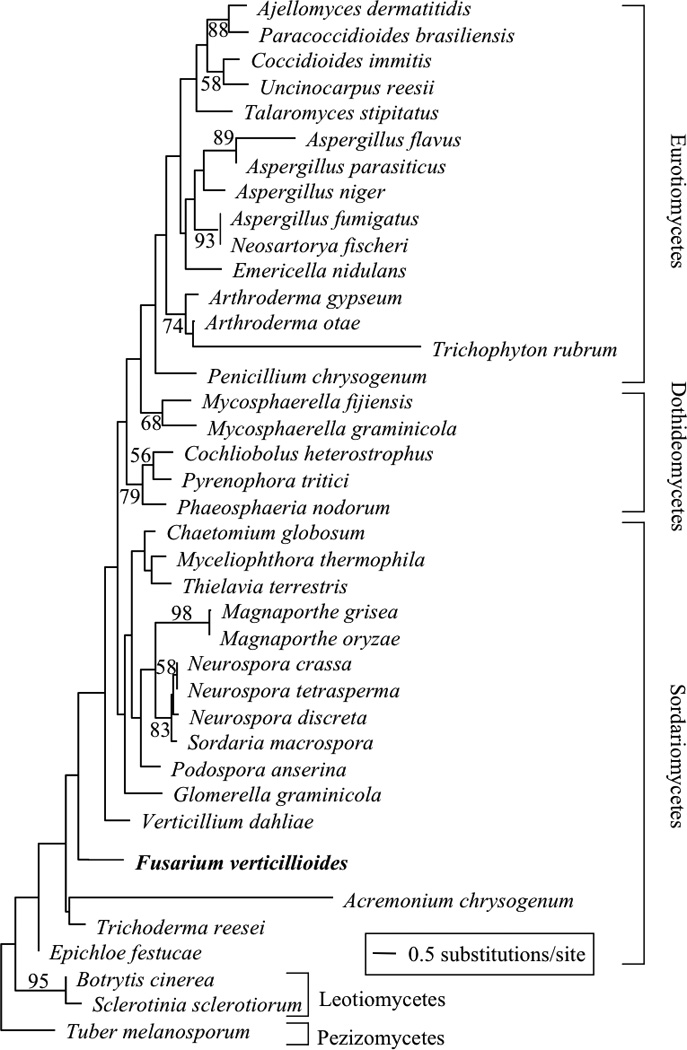
Figure 1.

Maximum likelihood tree obtained from analysis of third codon position nucleotides in the 5' conserved region of veA. Taxonomic classes are indicated. Values along the branches are maximum likelihood bootstrap percentages. Branch lengths are proportional to the number of changes along the branch.
