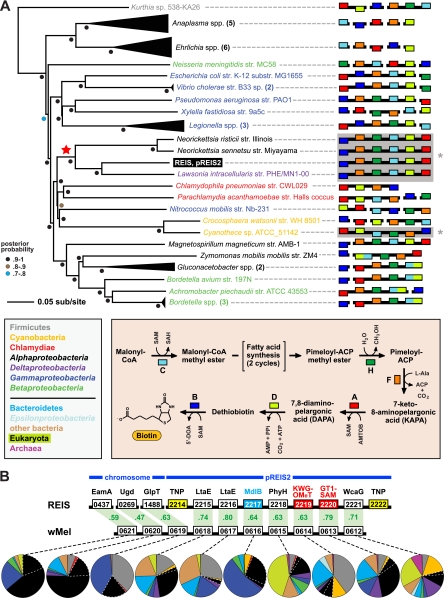
Fig 2.
Two regions of lateral gene transfer (LGT) on pREIS2. (A) LGT of a biotin (bio) operon between the obligate intracellular bacteria REIS, Neorickettsia spp., and Lawsonia intracellularis (noted with a red star at the root). Phylogeny was estimated from the concatenation of six bio genes (bioC, bioH, bioF, bioA, bioD, and bioB; see Table S4 in the supplemental material) from 39 diverse bacteria across seven major taxonomic groups (see the color scheme in the inset at the bottom left; only taxonomic groups above the line are represented in the tree). The schema at the right show the gene order and coding strand for all bio genes per genome, with breaks in black bars denoting noncontiguous genes. The contiguous arrays of all six bio genes in REIS, Neorickettsia spp., Lawsonia intracellularis, and Cyanotheca sp. strain ATCC 51142 are shaded and denoted with an asterisk (see the text for further details). Gene color is described in the inset at the bottom right, which illustrates the recent amendment to the biotin synthesis pathway (75). (B) LGT of a 10-gene region between the prophage WO-B of the Wolbachia endosymbiont of Drosophila melanogaster (wMel) and REIS. EamA, S-adenosylmethionine (SAM) transporter; Ugd, UDP-glucose 6-dehydrogenase; GlpT, glycerol-3-phosphate transporter; LtaE, low-specificity l-threonine aldolase; MdlB, ATP-binding multidrug resistance transporter; PhyH, phytanoyl-CoA dioxygenase; KWG-OMeT, N-terminal KWG repeat domain fused to C-terminal O-methyltransferase (type 2) domain; GT1-SAM, N-terminal glycosyltransferase (type1) domain fused to C-terminal radical SAM domain; WcaG, nucleoside-diphosphate-sugar epimerase. The MdlB ORF is colored blue and is included in the estimated phylogeny shown in Fig. 6. The two domain fusion proteins are colored red and were detected as contiguous ORFs in only one other bacterial genome, Haliangium ochraceum (KWG-OMeT, YP_003265293; GT1-SAM, YP_003265292). The two transposases (TNPs) flanking the pREIS2-carried ORFs are colored yellow. Orthology across REIS and wMel genes is shown with green shading, with percent similarity listed for each comparison. Dashed lines connect each gene with a graphical depiction of the top 100 Blastp subjects using the REIS sequences as queries. The taxonomic color scheme is the same as that in the inset in panel A, with taxa listed from top to bottom (Firmicutes to Archeae) depicted clockwise starting at 12 o'clock on the graphs. Dashed white lines distinguish the Rickettsiales subjects from the remaining Alphaproteobacteria. Additional information pertaining to this region is found in Fig. S2 in the supplemental material.

