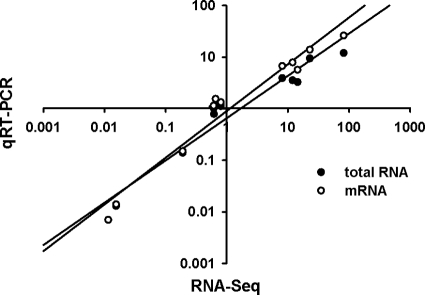
Fig 2.
Verification of RNA-Seq gene expression analysis by qRT-PCR. Individual gene expression ratios were calculated using RPKM values generated via RNA-Seq and plotted against calculations done for the same gene using qRT-PCR on both total RNA and mRNA as templates. Each qRT-PCR assay was performed on the sample subject to RNA-Seq plus two independent samples. Pearson correlations of 0.964 (P = 5.5 × 10⁻⁷) and 0.898 (P = 7.5 × 10⁻⁵) were obtained when mRNA and total RNA served as the template, respectively, in the qRT-PCRs.

