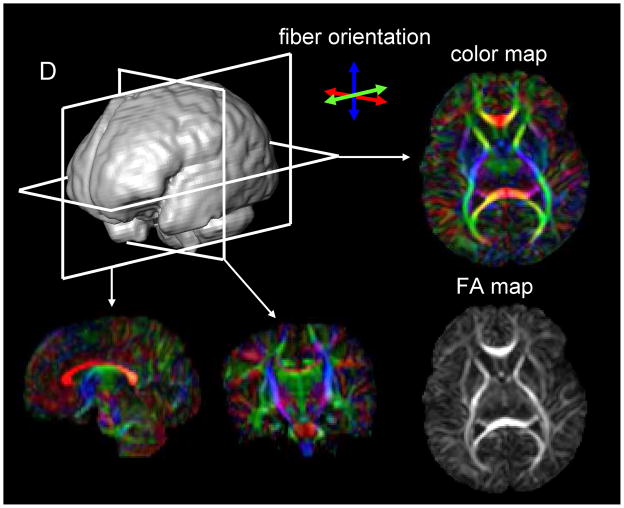
Fig. 4.
DTI-based images of a neonatal brain. The raw data are three-dimensional and arbitrary slice angles and positions can be extracted. The FA and color maps have the same image intensity, but the color map has additional orientation information represented by colors. In the color map, fibers orienting along the right-left, dorsal-ventral, and caudal-rostral axes are indicated by the red, blue, and green colors, respectively.

