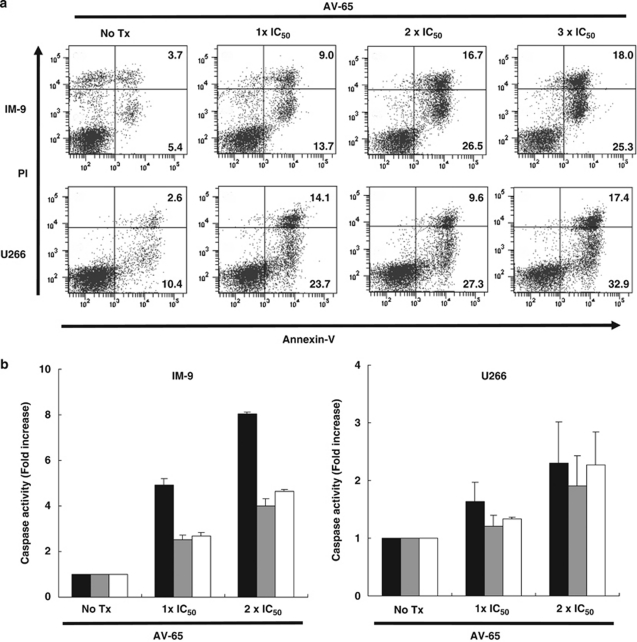
Figure 5.
Induction of apoptosis in myeloma cells by AV-65. (a) Cells were incubated with serial dilutions of AV-65 and harvested after 24 h. Data are representative of three independent experiments. The numbers inside each quadrant indicate the percentage of the cell population with the quadrant characteristic. (b) Cells were incubated with serial dilutions of AV-65 and harvested after 24 h. Harvested cells were lysed in lysis buffer, and then caspase-3, -8 and -9 activity was evaluated using a fluorometric protease assay. Data represent the means±s.d. of three independent experiments. Solid, gray and open bars indicate caspase-3, -8 and -9, respectively.

