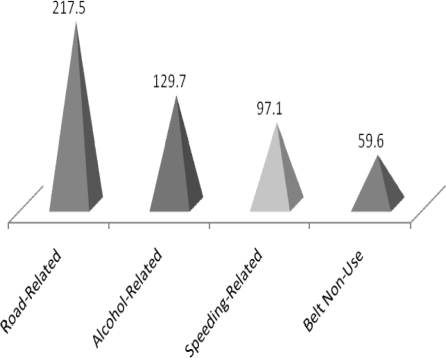
Figure 3.
2006 U.S. Cost of Crashes where Selected Factors Might Have Contributed to Crash Frequency or Severity (in billion 2006 dollars).
Note: In some crashes, more than one of the factors may have contributed to crash frequency or severity. The overlapping costs cannot be apportioned accurately between categories due to the probabilistic nature of our estimation procedures. These estimates should not be added together in order to account for the portion of costs that represent the combined factors.

