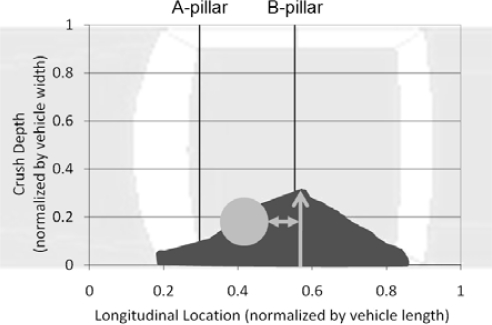
Figure 4:
A sample illustration of the crush metrics. The occupant location is denoted with a grey circle. The black section is the area of the crush as defined by the crush profile data. The gray arrow with the single head is the measured maximum crush. The double headed arrow is the distance from the occupant to the maximum crush location.

